# Gene Set Scoring Module
## Purpose
This module is based on AUCell, GSVA, IOBR and other R packages to perform multiple method scoring of custom gene set activity in bulk RNA-Seq data expression matrices, and visualize grouped heatmaps.
Supported gene set scoring algorithms:
* **ssGSEA**: Calculate enrichment scores based on cumulative distribution of gene expression ranking, supports single sample analysis
* **GSVA**: Kernel density estimation of gene expression distribution, outputs standardized enrichment scores
* **PCA**: Principal component analysis after gene expression standardization, takes first principal component score
* **Z-score**: Calculate the mean Z-score of genes within the gene set
* **AUCell**: Based on gene expression ranking, calculate the area under the curve (AUC) of gene sets in the top 5% highly expressed genes
## Input File Examples
* `expression` Expression matrix file: Each row represents a gene name, each column represents a sample name, values are corresponding expression levels, tab-separated
| GeneID | Sample1 | Sample2 | Sample3 |
| ------ | ------- | ------- | ------- |
| GENE1 | 1.234 | 2.345 | 3.456 |
| GENE2 | 4.567 | 5.678 | 6.789 |
* `clinical` Clinical information file: Each row represents a sample name, each column represents a clinical feature, tab-separated
| SampleID | tissue\_type.samples | age | gender |
| -------- | -------------------- | --- | ------ |
| Sample1 | Tumor | 45 | Male |
| Sample2 | Normal | 50 | Female |
| Sample3 | Tumor | 55 | Male |
* `gene_set` Gene set file: Header is gene set name, each row represents one gene name
test_geneset
CD8A
CD8B
GZMA
GZMB
## Running Method
```bash
SDAS bulkValidate geneSetScore --expression fpkm.txt --gene_set geneset.txt --clinical clinical.txt --group_col tissue_type.samples --group_type discrete --output result_dir
```
## Input Parameter Description
| Parameter | Required | Default | Description |
| ---------------- | -------- | -------- | ------------------------------------------------------------------------------------------------------------------------------------------- |
| **--expression** | **Yes** | | Expression matrix file path. Tab-separated, rows: gene IDs, columns: sample IDs, values: FPKM/TPM etc., cannot be raw counts, cannot be log |
| **--clinical** | **Yes** | | Clinical information file path. Tab-separated, rows: sample IDs, columns: clinical features |
| **--group\_col** | **Yes** | | Grouping column name (must exist in clinical information file) |
| **--gene\_set** | **Yes** | | Custom gene set file path. First row is gene set name (e.g. test\_geneset) followed by one gene name per line |
| **--output** | **Yes** | | Output directory path |
| --group\_type | No | discrete | Grouping type: discrete/continuous, default discrete |
* `--group_type` **Grouping Type Description**
* Discrete grouping (discrete): Directly use categorical variables in clinical information for grouping, e.g.: Tumor vs Normal, Stage I vs Stage II vs Stage III
* Continuous grouping (continuous): Divide continuous variables into three groups by quantiles: Low, Medium, High
```
Quantiles: 0%, 30%, 70%, 100%
```
## Output Results Display
| Result File | Description |
| ------------------------------- | -------------------------------------------- |
| `genescore_combine.txt` | Combined results of all scoring methods |
| `geneset_score_heatmap.png/pdf` | Grouped heatmap of different scoring methods |
* **Gene set scoring result table:** `genescore_combine.txt` Each row represents one sample, each column represents results of different scoring methods.
| SampleID | test\_geneset\_AUCell | test\_geneset\_GSVA | test\_geneset\_zscore | test\_geneset\_ssGSEA | test\_geneset\_PCA |
| -------- | --------------------- | ------------------- | --------------------- | --------------------- | ------------------ |
| Sample1 | 0.123 | 0.456 | 9.065 | 9.065 | 9.065 |
| Sample2 | 0.234 | 0.567 | 0.0677 | 0.0677 | 0.0677 |
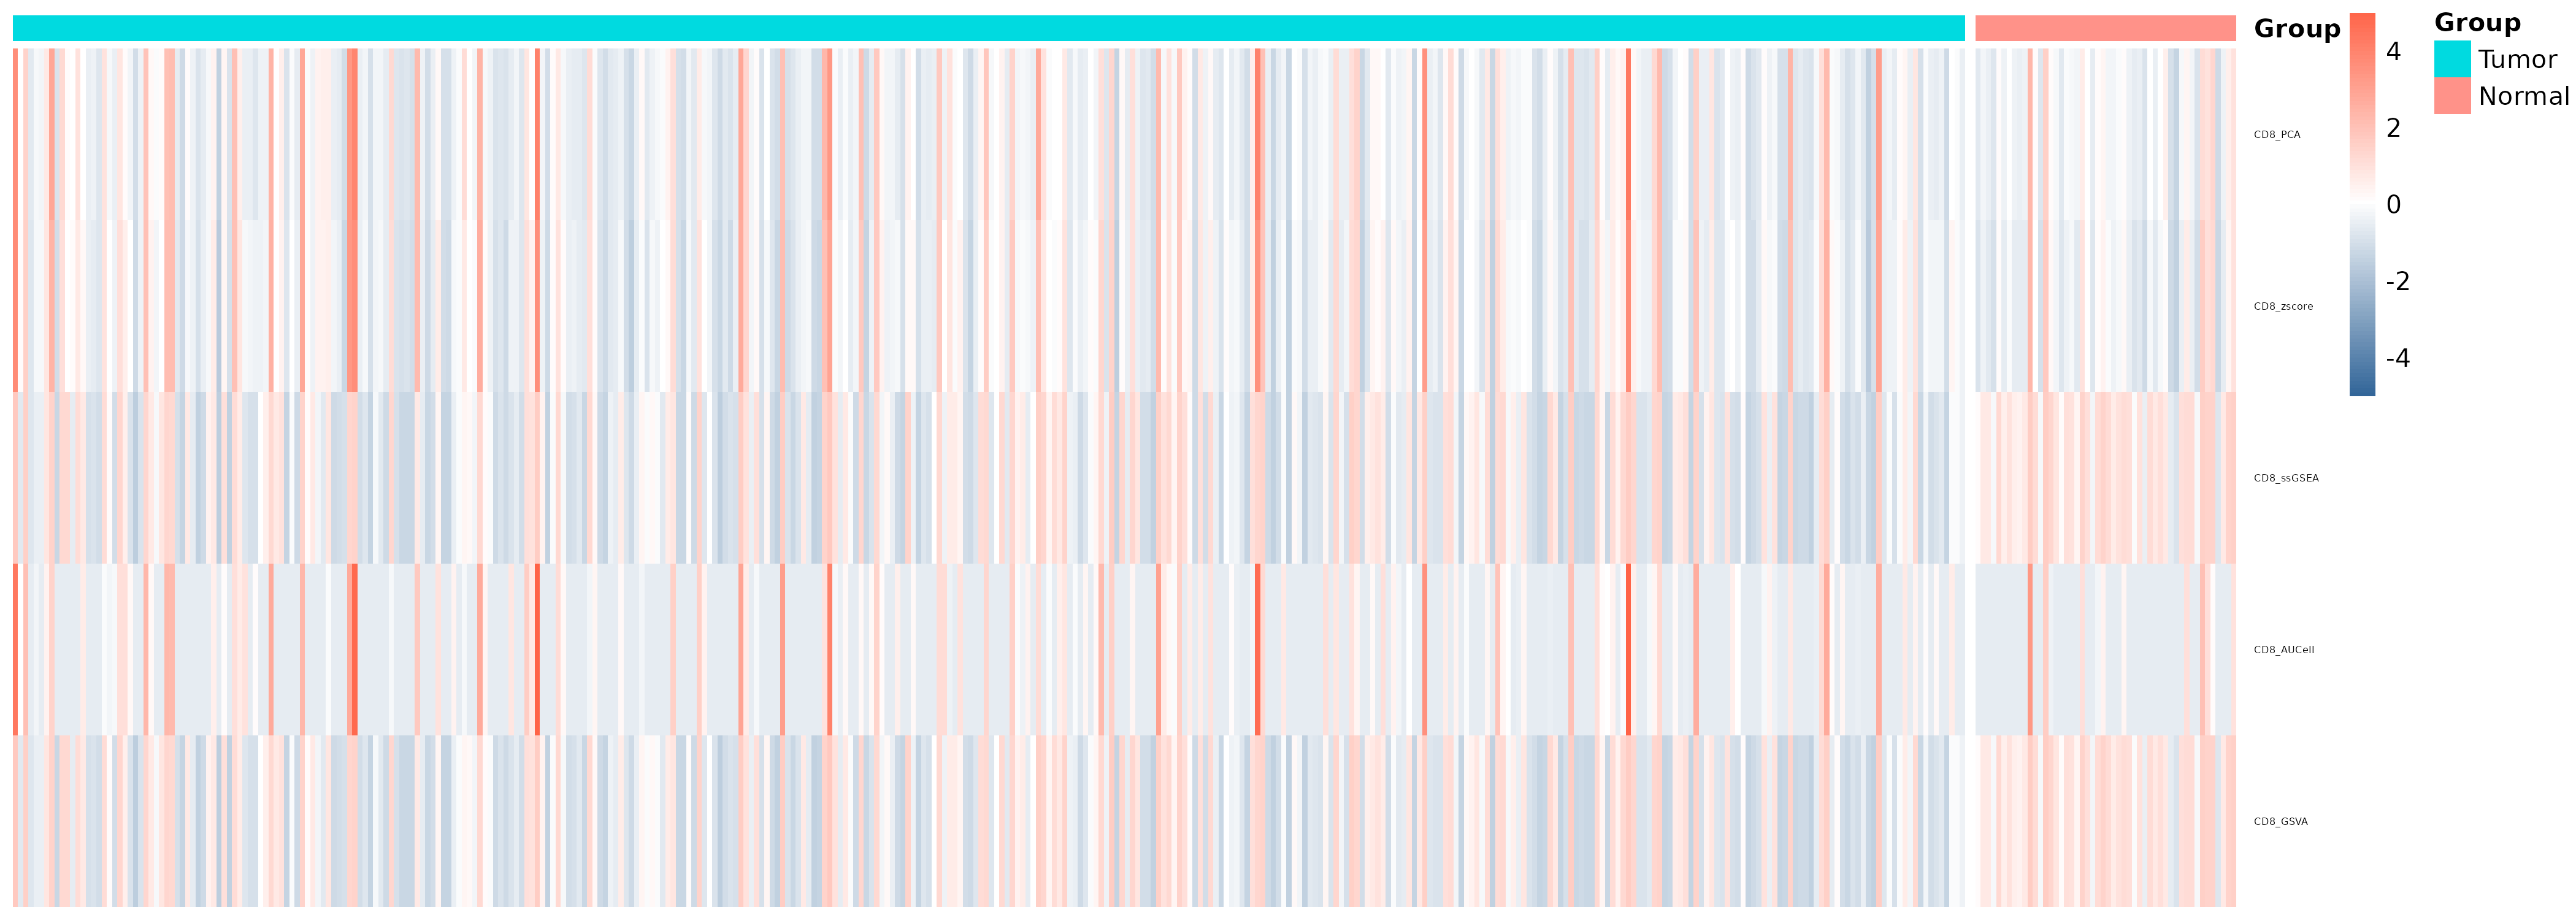
* **Gene set scoring heatmap:** `geneset_score_heatmap.png/pdf` Shows expression scores of specified gene sets for all samples.
## Result Interpretation Description
* **Gene set scoring result table:** `genescore_combine.txt`
* If using TCGA bulk transcriptome, prioritize GSVA or ssGSEA for interpretation, these two methods have robust results and can support complex pathways
* If you need to preserve gene correlation, prioritize PCA for interpretation
* If you want quick analysis, prioritize Z-score for interpretation